Population: How Many People Live in Clermont?
Evidently, the population has exploded in Clermont since 2010.
Currently, the population is 35,209 with a median age of 44.
For Sale Statistics
February, 2021
| Average Homes Prices: | $329,640 |
| Average Price Per Square Foot: | $156.43 |
| For Sale Inventory: | 154 Properties |
| Homes Sold: | 137 Properties |
| Average Time To Sale: | 38 Days |
| Average Mortgate Rates: | 2.73% |
For Rent Statistics
February, 2021
| Average Rental Price: | $1,901 |
| Average Rental Price Per Square Foot: | $1.02 |
| For Rent Inventory: | 24 Properties |
| Homes Rented: | 30 Properties |
| Average Time To Rent: | 25 Days |
Demographics
Area´s Population:
35,209 People
Average Household Income:
$64,736 Per Year
Area´s Area Size
15.9 Square Miles
*Data provided by StellarMLS and Orlando Realtors Association
Clermont FL is often referred to as “The Choice of Champions,” and it’s not hard to see why. As a matter of fact, its sprawling hillsides, athletic facilities, numerous sparkling lakes and temperate weather make it one of the training cities of choice for the nation’s triathletes…and of course, the nation’s homebuyers. Given how much Clermont real estate investments have appreciated over the past decade, it’s safe to say that the Clermont real estate market is going strong. The Clermont average home price is on the rise and housing market statistics show that they will continue to rise. Therefore, we highly recommend that you add Clermont to your list if you’re considering your next big move to the Orlando area. Contact Authentic Real Estate Team today!
Clermont’s real estate market forecast for 2021 is looking encouraging.
Indeed, it doesn’t hurt that Clermont consistently makes the list of the top 20 cities in America.
Homes and real estate investments here are highly profitable, and sales are on the rise.
And figures are projected to keep rising into 2021.
Count on Authentic Real Estate Team to help you get in on the developing Clermont housing market.
By and large, Florida’s population growth is enormous.
Almost every city in the region is benefitting from this boom, Clermont included.
As buyer demand increases, so too do average and median home prices.
As of February, 2021 the average home price in Clermont is $329,640.
While the median home price is $318,250.
| Homes Prices | Average | Median |
| Condo | $149,000 | $148,000 |
| Townhouse | $241,382 | $243,000 |
| Single Family | $309,840 | $295,000 |
| Overall | $305,056 | $289,950 |
| Homes Prices | Average | Median |
| Condo | $214,500 | $206,098 |
| Townhouse | $232,000 | $227,000 |
| Single Family | $302,027 | $293,500 |
| Overall | $298,136 | $290,000 |
| Homes Prices | Average | Median |
| Condo | $212,500 | $209,098 |
| Townhouse | $219,983 | $212,500 |
| Single Family | $329,508 | $302,075 |
| Overall | $323,110 | $300,000 |
| Homes Prices | Average | Median |
| Condo | $130,000 | $126,000 |
| Townhouse | $360,840 | $267,750 |
| Single Family | $317,804 | $300,000 |
| Overall | $312,917 | $289,000 |
| Homes Prices | Average | Median |
| Condo | $107,250 | $107,250 |
| Townhouse | $209,857 | $210,000 |
| Single Family | $327,866 | $300,000 |
| Overall | $322,380 | $297,000 |
| Homes Prices | Average | Median |
| Condo | $120,000 | $118,780 |
| Townhouse | $255,905 | $246,934 |
| Single Family | $325,322 | $305,000 |
| Overall | $317,852 | $299,950 |
| Homes Prices | Average | Median |
| Condo | $172,500 | $180,000 |
| Townhouse | $230,436 | $215,000 |
| Single Family | $335,702 | $302,000 |
| Overall | $329,269 | $295,995 |
| Homes Prices | Average | Median |
| Condo | $172,500 | $180,000 |
| Townhouse | $293,571 | $277,500 |
| Single Family | $335,910 | $311,833 |
| Overall | $331,305 | $309,000 |
| Homes Prices | Average | Median |
| Condo | $90,000 | $98,400 |
| Townhouse | $206,693 | $200,000 |
| Single Family | $341,596 | $320,000 |
| Overall | $335,131 | $315,000 |
| Homes Prices | Average | Median |
| Condo | $143,500 | $125,500 |
| Townhouse | $212,940 | $215,750 |
| Single Family | $343,678 | $303,000 |
| Overall | $334,845 | $296,500 |
| Homes Prices | Average | Median |
| Condo | $153,253 | $129,450 |
| Townhouse | $311,270 | $277,450 |
| Single Family | $489,656 | $400,500 |
| Overall | $328,080 | $308,740 |
| Homes Prices | Average | Median |
| Condo | $205,000 | $205,000 |
| Townhouse | $258,071 | $269,000 |
| Single Family | $333,925 | $325,000 |
| Overall | $329,640 | $318,250 |
In truth, some Clermont real estate is very deluxe, owing to the luxurious atmosphere of the region.
For this reason, the average price per square foot is higher than the national average.
Looking at the numbers from February, 2021, Clermont housing market statistics reflect an average price per square foot of $156.43.
| Average Price Per Square Foot | $143.91 |
| Average Price Per Square Foot | $139.34 |
| Average Price Per Square Foot | $142.99 |
| Average Price Per Square Foot | $143.70 |
| Average Price Per Square Foot | $148.10 |
| Average Price Per Square Foot | $150.22 |
| Average Price Per Square Foot | $155.75 |
| Average Price Per Square Foot | $154.16 |
| Average Price Per Square Foot | $151.77 |
| Average Price Per Square Foot | $156.00 |
| Average Price Per Square Foot | $160.22 |
| Average Price Per Square Foot | $156.43 |
Given that Clermont’s population is rising, inventory is going down.
In fact, in February, 2021 there were only 154 properties available on the Clermont market.
| Condo | 10 |
| Townhouse | 13 |
| Single Family | 120 |
| Overall | 143 |
| Condo | 12 |
| Townhouse | 14 |
| Single Family | 124 |
| Overall | 150 |
| Condo | 8 |
| Townhouse | 4 |
| Single Family | 122 |
| Overall | 134 |
| Condo | 6 |
| Townhouse | 22 |
| Single Family | 130 |
| Overall | 158 |
| Condo | 5 |
| Townhouse | 14 |
| Single Family | 119 |
| Overall | 138 |
| Condo | 9 |
| Townhouse | 15 |
| Single Family | 106 |
| Overall | 130 |
| Condo | 3 |
| Townhouse | 7 |
| Single Family | 112 |
| Overall | 122 |
| Condo | 5 |
| Townhouse | 11 |
| Single Family | 119 |
| Overall | 135 |
| Condo | 3 |
| Townhouse | 6 |
| Single Family | 101 |
| Overall | 110 |
| Condo | 4 |
| Townhouse | 8 |
| Single Family | 107 |
| Overall | 119 |
| Condo | 11 |
| Townhouse | 10 |
| Single Family | 78 |
| Overall | 99 |
| Condo | 1 |
| Townhouse | 7 |
| Single Family | 146 |
| Overall | 154 |
While real estate inventory is decreasing, the number of homes sold in Clermont is increasing.
Therefore, in February, 2021 there were 137 properties sold in Clermont.
| Condo | 2 |
| Townhouse | 9 |
| Single Family | 185 |
| Overall | 196 |
| Condo | 0 |
| Townhouse | 6 |
| Single Family | 102 |
| Overall | 108 |
| Condo | 1 |
| Townhouse | 6 |
| Single Family | 114 |
| Overall | 121 |
| Condo | 1 |
| Townhouse | 10 |
| Single Family | 144 |
| Overall | 155 |
| Condo | 2 |
| Townhouse | 7 |
| Single Family | 222 |
| Overall | 231 |
| Condo | 1 |
| Townhouse | 7 |
| Single Family | 182 |
| Overall | 190 |
| Condo | 0 |
| Townhouse | 11 |
| Single Family | 169 |
| Overall | 180 |
| Condo | 3 |
| Townhouse | 7 |
| Single Family | 176 |
| Overall | 186 |
| Condo | 1 |
| Townhouse | 7 |
| Single Family | 177 |
| Overall | 185 |
| Condo | 3 |
| Townhouse | 10 |
| Single Family | 203 |
| Overall | 216 |
| Condo | 1 |
| Townhouse | 6 |
| Single Family | 130 |
| Overall | 137 |
| Condo | 1 |
| Townhouse | 6 |
| Single Family | 130 |
| Overall | 137 |
As the Clermont FL housing market heats up, buyers are becoming more active.
As a result, as of February, 2021 the average time to sell a home in Clermont has decreased to only 38 days on average.
In short, homes are flying off the market in record time.
| Average Time To Sale | 55 Days |
| Average Time To Sale | 62 Days |
| Average Time To Sale | 53 Days |
| Average Time To Sale | 48 Days |
| Average Time To Sale | 55 Days |
| Average Time To Sale | 42 Days |
| Average Time To Sale | 45 Days |
| Average Time To Sale | 35 Days |
| Average Time To Sale | 28 Days |
| Average Time To Sale | 35 Days |
| Average Time To Sale | 41 Days |
| Average Time To Sale | 38 Days |
Rather important for any Clermont real estate investment decision is the going mortgage rate.
As of February, 2021 mortgage rates are low at just 2.73%.
In brief, this minimizes financial risk to buyers makes it easier for them to close on deals.
| Average Mortage Rates | 3.45% |
| Average Mortage Rates | 3.20% |
| Average Mortage Rates | 3.22% |
| Average Mortage Rates | 3.04% |
| Average Mortage Rates | 2.97% |
| Average Mortage Rates | 2.85% |
| Average Mortage Rates | 2.74% |
| Average Mortage Rates | 2.72% |
| Average Mortage Rates | 2.70% |
| Average Mortage Rates | 2.70% |
| Average Mortage Rates | 2.73% |
| Average Mortage Rates | 2.73% |
While many real estate experts, investors and economist forecasted financial devastation as a result of the Coronavirus, the Clermont real estate market held up nicely,
Overall, Clermont homes for sale don’t stay on the real estate market for long as the Clermont average home price is increasing but is still affordable.
This agricultural-citrus-town-turned-sunny-suburb is extremely popular among young families and retirees.
Firstly, the stunningly beautiful nature here attracts hikers, bird-watchers, campers, kayakers and horseback riders all year round.
Secondly, there’s lots to do as Clermont is only 25 miles from downtown Orlando.
Here, you’ll find the world famous amusement parks like Walt Disney World, Universal Studios, and Sea World.
Additionally, there’s the famous International Drive which is home to some of the best restaurants, bars and nightlife around.
Given these points, it’s not hard to see why homes for sale in Clermont are in high demand.
Above all, Clermont’s economic growth is shaping the demographics of the community, and vice versa.
Almost half of the population is employed.
Furthermore, there are 11,200 households in Clermont, 28% of which had children under the age of 18.
The average family size is 2.73 and only 8% of houses and apartments were unoccupied.
| Area´s Population | 35,209 |
| Average Household Income | $64,736 |
| Area´s Area Size | 15.9 |
| Area´s Population | 35,209 |
| Average Household Income | $64,736 |
| Area´s Area Size | 15.9 |
| Area´s Population | 35,209 |
| Average Household Income | $64,736 |
| Area´s Area Size | 15.9 |
| Area´s Population | 35,209 |
| Average Household Income | $64,736 |
| Area´s Area Size | 15.9 |
| Area´s Population | 35,209 |
| Average Household Income | $64,736 |
| Area´s Area Size | 15.9 |
| Area´s Population | 35,209 |
| Average Household Income | $64,736 |
| Area´s Area Size | 15.9 |
| Area´s Population | 35,209 |
| Average Household Income | $64,736 |
| Area´s Area Size | 15.9 |
| Area´s Population | 35,209 |
| Average Household Income | $64,736 |
| Area´s Area Size | 15.9 |
| Area´s Population | 35,209 |
| Average Household Income | $64,736 |
| Area´s Area Size | 15.9 |
| Area´s Population | 35,209 |
| Average Household Income | $64,736 |
| Area´s Area Size | 15.9 |
| Area´s Population | 35,209 |
| Average Household Income | $64,736 |
| Area´s Area Size | 15.9 |
| Area´s Population | 35,209 |
| Average Household Income | $64,736 |
| Area´s Area Size | 15.9 |
Evidently, the population has exploded in Clermont since 2010.
Currently, the population is 35,209 with a median age of 44.
Basically, the average and median household incomes fall in line with the national averages.
In total, Clermont is 17.33 square miles in size, and the population density is 2,364 per square mile.
While the Coronavirus didn’t have much of an effect on the Clermont real estate market, housing market statistics tell a different story about the rental market.
In short, because Florida issued a ban on all short-term rental contracts in response to the Covid-19 crisis.
That had a huge impact on the normally strong Orlando area rental market.
In effect, the occupancy rate for rental properties, be they short-term or long-term contracts, dropped to only 40% of the typical rates.
However, if we look ahead to the real estate market forecast for 2021, rental statistics show strong signs of recovery.
In fact, for the Christmas and New York holidays, the occupancy rate was back up to 100%.
Another key point about the real estate rental market in Clermont is that the average rental price is on the rise.
Because Florida gets almost 1,000 new residents every day, rental properties are also in high demand.
Therefore, the average rental price in Clermont reached $1,901 per month in February, 2021.
| Rental Prices | Average | Median |
| Condo | $1,329 | $1,320 |
| Townhouse | $1,690 | $1,700 |
| Single Family | $1,756 | $1,755 |
| Overall | $1,749 | $1,753 |
| Rental Prices | Average | Median |
| Condo | $1,330 | $1,320 |
| Townhouse | $1,774 | $1,779 |
| Single Family | $1,736 | $1,700 |
| Overall | $1,736 | $1,700 |
| Rental Prices | Average | Median |
| Condo | $1,340 | $1,290 |
| Townhouse | $1,775 | $1,780 |
| Single Family | $1,782 | $1,715 |
| Overall | $1,782 | $1,720 |
| Rental Prices | Average | Median |
| Condo | $1,350 | $1,350 |
| Townhouse | $1,550 | $1,600 |
| Single Family | $1,770 | $1,750 |
| Overall | $1,750 | $1,700 |
| Rental Prices | Average | Median |
| Condo | $1,380 | $1,278 |
| Townhouse | $1,920 | $1,879 |
| Single Family | $1,958 | $1,850 |
| Overall | $1,957 | $1,850 |
| Rental Prices | Average | Median |
| Condo | $1,200 | $1,239 |
| Townhouse | $1,553 | $1,550 |
| Single Family | $1,879 | $1,850 |
| Overall | $1,813 | $1,815 |
| Rental Prices | Average | Median |
| Condo | $1,180 | $1,378 |
| Townhouse | $1,415 | $1,495 |
| Single Family | $1,862 | $1,810 |
| Overall | $1,824 | $1,795 |
| Rental Prices | Average | Median |
| Condo | $1,380 | $1,278 |
| Townhouse | $1,595 | $1,432 |
| Single Family | $1,799 | $1,778 |
| Overall | $1,791 | $1,760 |
| Rental Prices | Average | Median |
| Condo | $1,300 | $1,380 |
| Townhouse | $1,697 | $1,697 |
| Single Family | $1,852 | $1,825 |
| Overall | $1,843 | $1,800 |
| Rental Prices | Average | Median |
| Condo | $1,300 | $1,300 |
| Townhouse | $1,598 | $1,500 |
| Single Family | $1,803 | $1,800 |
| Overall | $1,772 | $1,800 |
| Rental Prices | Average | Median |
| Condo | $1,488 | $1,488 |
| Townhouse | $1,750 | $1,800 |
| Single Family | $1,789 | $1,750 |
| Overall | $1,776 | $1,750 |
| Rental Prices | Average | Median |
| Condo | $1,488 | $1,488 |
| Townhouse | $1,750 | $1,800 |
| Single Family | $1,901 | $1,813 |
| Overall | $1,901 | $1,813 |
The Orlando rental market is worth over $30 billion.
It’s no wonder, then, why the average price per square foot for a rental property is high, at about $1.02 as of February, 2021.
| Average Rental Price Per Square Foot | $0.95 |
| Average Rental Price Per Square Foot | $0.95 |
| Average Rental Price Per Square Foot | $1.00 |
| Average Rental Price Per Square Foot | $1.01 |
| Average Rental Price Per Square Foot | $0.92 |
| Average Rental Price Per Square Foot | $1.09 |
| Average Rental Price Per Square Foot | $0.99 |
| Average Rental Price Per Square Foot | $0.93 |
| Average Rental Price Per Square Foot | $1.02 |
| Average Rental Price Per Square Foot | $1.01 |
| Average Rental Price Per Square Foot | $1.02 |
| Average Rental Price Per Square Foot | $1.02 |
As an illustration of Clermont’s increasing popularity, rental inventory disappears quickly from this housing market.
As of February, 2021 only 24 properties were available here to rent.
| Condo | 1 |
| Townhouse | 4 |
| Single Family | 44 |
| Overall | 49 |
| Condo | 0 |
| Townhouse | 5 |
| Single Family | 37 |
| Overall | 42 |
| Condo | 1 |
| Townhouse | 3 |
| Single Family | 35 |
| Overall | 39 |
| Condo | 0 |
| Townhouse | 3 |
| Single Family | 32 |
| Overall | 35 |
| Condo | 2 |
| Townhouse | 4 |
| Single Family | 40 |
| Overall | 46 |
| Condo | 1 |
| Townhouse | 3 |
| Single Family | 34 |
| Overall | 38 |
| Condo | 0 |
| Townhouse | 6 |
| Single Family | 29 |
| Overall | 35 |
| Condo | 2 |
| Townhouse | 5 |
| Single Family | 27 |
| Overall | 34 |
| Condo | 1 |
| Townhouse | 2 |
| Single Family | 29 |
| Overall | 32 |
| Condo | 0 |
| Townhouse | 3 |
| Single Family | 31 |
| Overall | 34 |
| Condo | 2 |
| Townhouse | 1 |
| Single Family | 32 |
| Overall | 35 |
| Condo | 0 |
| Townhouse | 3 |
| Single Family | 21 |
| Overall | 24 |
Whether homes in Clermont are ‘for sale’ or ‘for rent,’ they never last quickly on the real estate market.
More and more, new Florida residents are eager to get in on Clermont real estate investments.
In fact, housing market statistics show that 30 homes were rented out in February, 2021.
| Condo | 0 |
| Townhouse | 5 |
| Single Family | 45 |
| Overall | 50 |
| Condo | 0 |
| Townhouse | 0 |
| Single Family | 33 |
| Overall | 33 |
| Condo | 0 |
| Townhouse | 1 |
| Single Family | 53 |
| Overall | 54 |
| Condo | 2 |
| Townhouse | 3 |
| Single Family | 53 |
| Overall | 58 |
| Condo | 0 |
| Townhouse | 1 |
| Single Family | 43 |
| Overall | 44 |
| Condo | 1 |
| Townhouse | 8 |
| Single Family | 41 |
| Overall | 50 |
| Condo | 0 |
| Townhouse | 3 |
| Single Family | 32 |
| Overall | 35 |
| Condo | 0 |
| Townhouse | 1 |
| Single Family | 26 |
| Overall | 27 |
| Condo | 0 |
| Townhouse | 2 |
| Single Family | 33 |
| Overall | 35 |
| Condo | 1 |
| Townhouse | 3 |
| Single Family | 33 |
| Overall | 37 |
| Condo | 2 |
| Townhouse | 3 |
| Single Family | 37 |
| Overall | 42 |
| Condo | 0 |
| Townhouse | 0 |
| Single Family | 30 |
| Overall | 30 |
As has been noted, the Clermont real estate rental market is on the rise.
As the market strengthen the average time it takes to rent a home here goes down.
On average, as of February, 2021 the rental process takes only 25 days.
| Average Time to Rent | 32 Days |
| Average Time to Rent | 39 Days |
| Average Time to Rent | 32 Days |
| Average Time to Rent | 26 Days |
| Average Time to Rent | 33 Days |
| Average Time to Rent | 27 Days |
| Average Time to Rent | 22 Days |
| Average Time to Rent | 26 Days |
| Average Time to Rent | 29 Days |
| Average Time to Rent | 37 Days |
| Average Time to Rent | 30 Days |
| Average Time to Rent | 25 Days |
One of the most trusted housing market authorities, the Orlando Regional Realtors Association, recently released housing market statistics relevant to Clermont.
Indeed, it includes important information like Clermont average home prices among other real estate news.
In short, this report provides further evidence that there has never been a better time to purchase Clermont real estate.
Demand is high but interest rates are low which are both indicators of a strong seller’s market.
In other words, as a Clermont real estate investor, you’re sure to reap the benefits of high appreciation values!
Why Should I Buy a Property in Clermont, Florida?
Though Clermont is an award-winning city and is ranked one of the best places to live in central Florida, it still remains its community charm.
Without a doubt, there’s a lot happening in the way of breaking Clermont real estate news.
Most interesting is that developments are coming up all over the region.
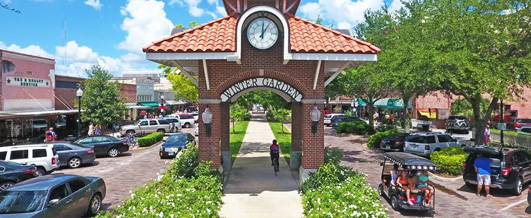
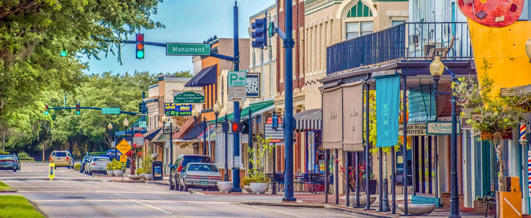
For example, neighboring communities like Celebration and Winter Garden are getting thousands of new housing units.
Island Village in Celebration is only 25 miles away from Clermont.
Here, 1,300 new single-family homes are in the works and more are on the way.
Additionally, Hamlin Reserve in Winter Garden is building up hundreds of new lakeside apartments along with numerous high-end shops and restaurants.
In short, the region is developing with no end in sight.
Emphatically, there is no denying that Orlando is entering into an economic golden era.
To this end, the population is skyrocketing as Florida acquires 30,000 new residents every month.
Additionally, the unemployment rate is going down, home values are rising and appreciation has been consistent for the past decade.
With more people in the state and on the job market, homes for sale are going quickly.
Therefore, the Clermont real estate market forecast for 2021 is looking formidable for the foreseeable future.
In general, Florida’s future is looking bright.
It’s getting an influx of new residents - most of them monied, educated and experienced in real estate investing.
As it stands, Florida’s GDP is ranked the fourth strongest in the country.
However, there is mounting evidence that Florida is primed to take New York for the #3 spot.
Consequently, as the Florida economy grows, the Clermont and Orlando real estate markets will too.
In this list that follows, you’ll find data about the Clermont real estate and housing market over the last fourteen years.
On the negative side of these, the Orlando real estate market struggled in the 2000s.
In short, YoY property sales in Orlando and Clermont were down by 30%.
Median home prices plateaued and there was so much inventory surplus.
Another bad sign was that the Sell/List price difference was only 93% which negatively impacted sellers.
2008’s performance was no better.
Clermont’s real estate market still took a hit with low YoY property sales and high levels of surplus inventory.
However, the end of the year brought some relief with an increase in sales and strong December performance of a 30% sales increase.
Finally, 2009 made a slight departure from the two years previous.
YoY sales increased every month in the year by over 30% and inventory levels went down as demand rose.
Seeing that November had a 109% YoY sales increase, things were looking good for the Orlando and Clermont real estate markets.
Additionally, average home prices were riding high at about $270,000.
Despite poor performance of the previous years, 2010 finally welcomed the rise of a seller’s market.
In fact, interest rates were low and buyers were more eager to close sales.
On average, YoY sales got a massive bump of over 70% in the first half of 2010.
In addition, the Sell/List price difference rose to 95%.
In many ways, 2011’s Clermont and Orlando housing market statistics did not change much from 2010’s.
At length, Clermont real estate properties and investments kept their valuation and average price.
Furthermore, the Sell/List price difference was stable at 95%.
Altogether, 2012 was a great year for the Clermont FL housing market.
In short, there were strong and consistent sales every month which increased even more during the second part of the year.
Likewise, the Orlando and Clermont average home price went up to about $350,000.
All things considered, sellers also benefitted as the Sell/List price difference went up a notch to 96%.
In similar fashion, 2013 delivered strong results.
Clermont real estate news and market statistics from this year show strong YoY sales increases from January to September.
Here, the average home price in Orlando and Clermont as a whole ranged from about $167,000 to $200,000.
Following a few good years, the Clermont real estate market was not as strong in 2014.
In the first half of the year, sales dropped but they began to recover in the last quarter.
Be that as it may, inventory figures were as high as 10,000 in some months and unfortunately, the average home price in Clermont stayed the same.
From 2015 onwards, the Clermont real estate market performed generally well.
In brief, the first three quarters of this year brought YoY sales increases of 8% to 40%.
However, inventory surplus was still relatively high and Clermont’s average home price remained unchanged.
Sellers were especially happy this year as Sell/List price differences reached an all time high of 97%.
While the year was full of fluctuations, some months did realise significant YoY sales increases.
By and large, 2017 marked the start of the Clermont and Orlando real estate market booms that we are currently experiencing.
The number of Clermont real estate investments made increased greatly.
Housing market statistics show that YoY sales went up by 3% to 14 percent every month.
Additionally, average home prices around Clermont and the Orlando region increased to $270,000.
In this year, property inventory was snatched quickly off the market decreasing the availability of homes for sale in Clermont.
In fact, 3/4 of the year saw sharp YoY sales increases.
Things went very much in the favor of sellers in 2018 as average home prices landed at a whopping $250,000.
In general, 2019 was another positive year for the Orlando and Clermont FL housing markets.
To illustrate, Clermont housing market statistics show that YoY sales went up every month of the year and December realised a 25% increase.
Furthermore, the median sales prices rose to $260,000 and the Sell/List price difference stayed the same in Clermont FL.
Although 2020 was overshadowed by the deadly Coronavirus, real estate investments in Clermont got a boost.
With the exceptions of April and May, YoY sales hiked up every other month of the year.
The median sales price went up slightly and Sell/List prices were still high at 97%.
Authentic Real Estate Team forecasts that the real estate market for 2021 will continue on an upward trajectory.
Specifically, we think that higher sales and higher sales prices will be evident this year.
Didn’t find the data you were looking for here?
Check out our Orlando real estate market overview to see statistics for the entire Orlando area!
Whether you’re looking for a single-family home, villa, townhome, condo, or something in-between, count on an Authentic Real Estate Team real estate agent in Clermont to help you find it fast – and for less!
Single-family homes for sale in Clermont FL are the fastest-appreciating, fastest-re-selling property type you can buy.
With condos for sale in Clermont, you can have low-maintenance home away from home to use when you want, and rent out when you don’t.
Townhomes are the perfect compromise between single-family homes and condos.
But with townhomes for sale in Clermont, you never have to compromise on the luxury you deserve.
A private pool is the ultimate way to cool off in the summer.
And a great way to heat up your occupancy rates.
Count on Authentic Real Estate Team to help you find the best homes for sale in Clermont FL with pool, at the best prices, for your needs.
Clermont lakefront homes for sale don’t just afford amazing views and recreation options.
They’re a huge investment differentiator.
Homes for sale with guest house in Clermont FL give you increased curb appeal, a low-maintenance apartment to rent out, and a hassle-free way to host visiting friends and family.
Looking for a low-maintenance, high-appreciation investment option?
New homes for sale in Clermont could bejust what you’re looking for!
Dreaming of luxury homes for sale in Clermont FL?
Count on Authentic Real Estate Team to make your dreams come true!
Set amidst the rolling green hills of Lake County, Clermont vacation homes for sale offer a rare idyllic getaway on the edge of bustling Orlando.
Clermont villas for sale make every vacation the vacation of a lifetime.
As a family-friendly town, Clermont has plenty of tight-knit, safe gated communities to protect your family and assets.
Here’s just one example:
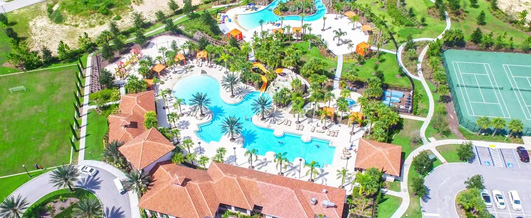
With luxury townhomes, a robust amenities package, and a mere 8-minute drive to Disney, Serenity Resort makes the perfect addition to your investment portfolio.
To sum up, Clermont’s property market is riding the Orlando economic wave.
And now is the time to make a Clermont real estate investment.
Get in touch with our team of trusted real estate brokers to see how Authentic Real Estate Team can make your Clermont real estate investment dreams come true!
See also the real estate market in other cities
See also the real estate market of
See also the real estate market of
See also the real estate market of
See also the real estate market of
See also the real estate market of
See also the real estate market of
See also the real estate market of
See also the real estate market of
See also the real estate market of
See also the real estate market of
See also the real estate market of
See also the real estate market of
Subscribe to our newsletter