Authentic Real Estate Team
Phone
Menu
Data updated
Data updated:
March 1, 2021

Lake Nona Real Estate market statistics and latest trends - March, 2021

For Sale Statistics

February, 2021

Average Homes Prices: $515,837
Average Price Per Square Foot: $195.66
For Sale Inventory: 68 Properties
Homes Sold: 115 Properties
Average Time To Sale: 39 Days
Average Mortgate Rates: 2.73%

For Rent Statistics

February, 2021

Average Rental Price: $2,210
Average Rental Price Per Square Foot: $1.10
For Rent Inventory: 42 Properties
Homes Rented: 45 Properties
Average Time To Rent: 24 Days

Demographics

Area´s Population:

11,718 People

Average Household Income:

$101,785.47 Per Year

Area´s Area Size

17 Square Miles

*Data provided by StellarMLS and Orlando Realtors Association

StellarMLS and Orlando Realtors Association

Your Most Up to Date Lake Nona Housing Market Overview

In Orlando, the population and economy are booming.

And In Lake Nona in particular, the real estate market is doing especially well. This popular Orlando suburb – home to great schools, world-class local amenities, and its famous Medical City - is seeing high growth as more families settle into this beautiful, safe, upper-middle class community.

Therefore, the Lake Nona housing market is one to watch. As of February, 2021 the averageLake Nona home price was $515,837 and housing market statistics show that this figure is expected to rise. For these reasons, investors and residential buyers should take note: there’s never been a better time to buy in Lake Nona. And there’s no better real.

What Is the Average & Median Home Price in Lake Nona, Florida?

Across the board, the average price of all homes sold in the Orlando region in February, 2021 was about $515,837 according to orlandorealtors.org.

Surprisingly, even in light of the pandemic, demand for real estate is on the rise, but inventory of properties for sale is low.

And it’s this combination of high demand and low inventory that’s driving up prices.

March, 2020
Homes Prices Average Median
Condo $229,748 $187,500
Townhouse $289,165 $282,357
Single Family $508,963 $405,000
Overall $447,840 $370,000
April, 2020
Homes Prices Average Median
Condo $238,000 $209,000
Townhouse $298,510 $301,429
Single Family $543,619 $460,500
Overall $485,056 $405,725
May, 2020
Homes Prices Average Median
Condo $238,248 $199,000
Townhouse $262,672 $264,000
Single Family $441,214 $400,000
Overall $375,945 $341,500
June, 2020
Homes Prices Average Median
Condo $193,000 $209,000
Townhouse $302,200 $399,500
Single Family $439,842 $402,500
Overall $417,506 $394,000
July, 2020
Homes Prices Average Median
Condo $234,830 $209,000
Townhouse $291,192 $280,000
Single Family $497,218 $414,901
Overall $439,591 $475,000
August, 2020
Homes Prices Average Median
Condo $214,167 $200,000
Townhouse $273,366 $277,000
Single Family $435,763 $399,000
Overall $400,383 $374,200
September, 2020
Homes Prices Average Median
Condo $224,265 $201,000
Townhouse $287,678 $280,500
Single Family $578,988 $457,536
Overall $500,404 $378,532
October, 2020
Homes Prices Average Median
Condo $222,375 $224,250
Townhouse $287,699 $288,479
Single Family $608,803 $480,000
Overall $519,040 $386,750
November, 2020
Homes Prices Average Median
Condo $268,630 $250,000
Townhouse $299,532 $294,226
Single Family $448,125 $416,300
Overall $410,755 $392,278
December, 2020
Homes Prices Average Median
Condo $164,055 $164,055
Townhouse $299,159 $298,000
Single Family $588,843 $465,000
Overall $535,450 $437,500
January, 2021
Homes Prices Average Median
Condo $326,605 $332,490
Townhouse $306,123 $333,520
Single Family $510,056 $455,000
Overall $477,571 $433,145
February, 2021
Homes Prices Average Median
Condo $283,086 $307,430
Townhouse $282,356 $277,500
Single Family $574,167 $490,470
Overall $515,837 $414,227
Average home price for the last 12 months in Lake Nona, Florida
Condo
Townhouse
Single Family
Overall
Average home price for the last 12 months in Lake Nona, Florida

For Sale: Average Price per Square Foot

Orlandorealtors.org confirms that we are experiencing a strong seller’s market as of January 2021.

Meaning buyer demand is higher than the supply of properties on the market.

Put simply, Orlando home sellers have more leverage when it comes to property sales price negotiations.

And the average price per square foot corroborates it.

In February, 2021 the average price per square foot was $195.66.

March, 2020
Average Price Per Square Foot $171.52
April, 2020
Average Price Per Square Foot $177.39
May, 2020
Average Price Per Square Foot $163.90
June, 2020
Average Price Per Square Foot $166.75
July, 2020
Average Price Per Square Foot $176.04
August, 2020
Average Price Per Square Foot $168.77
September, 2020
Average Price Per Square Foot $181.46
October, 2020
Average Price Per Square Foot $183.69
November, 2020
Average Price Per Square Foot $168.69
December, 2020
Average Price Per Square Foot $207.96
January, 2021
Average Price Per Square Foot $180.42
February, 2021
Average Price Per Square Foot $195.66
Average price per square foot for the last 12 months in Lake Nona, Florida
Average Price Per Square Foot
Average price per square foot for the last 12 months in Lake Nona, Florida

Lake Nona for Sale Real Estate Inventory

Another sign of a strong seller’s market as of January 2021 is that the availability of Lake Nona real estate inventory is low and getting lower.

But don’t just take our word for it.

The Lake Nona housing market statistics show that, in February, 2021 there were just 68 homes on the market.

Including 5 condos, 10 townhomes and 53 single-family homes.

March, 2020
For Sale Inventory
Condo 23
Townhouse 20
Single Family 85
Overall 128
April, 2020
For Sale Inventory
Condo 20
Townhouse 22
Single Family 95
Overall 137
May, 2020
For Sale Inventory
Condo 15
Townhouse 25
Single Family 88
Overall 128
June, 2020
For Sale Inventory
Condo 22
Townhouse 29
Single Family 102
Overall 153
July, 2020
For Sale Inventory
Condo 10
Townhouse 19
Single Family 83
Overall 112
August, 2020
For Sale Inventory
Condo 17
Townhouse 19
Single Family 76
Overall 112
September, 2020
For Sale Inventory
Condo 15
Townhouse 17
Single Family 78
Overall 110
October, 2020
For Sale Inventory
Condo 20
Townhouse 17
Single Family 87
Overall 124
November, 2020
For Sale Inventory
Condo 10
Townhouse 9
Single Family 69
Overall 88
December, 2020
For Sale Inventory
Condo 12
Townhouse 15
Single Family 77
Overall 104
January, 2021
For Sale Inventory
Condo 8
Townhouse 7
Single Family 63
Overall 78
February, 2021
For Sale Inventory
Condo 5
Townhouse 10
Single Family 53
Overall 68
For sale inventory for the last 12 months in Lake Nona, Florida
Condo
Townhouse
Single Family
Overall
For sale inventory for the last 12 months in Lake Nona, Florida

Sold Homes in Lake Nona

As more and more people pour across Florida’s border, sales in Lake Nona are on the rise.

In total, 115 homes were sold in Lake Nona in February, 2021.

March, 2020
Homes Sold
Condo 4
Townhouse 18
Single Family 61
Overall 83
April, 2020
Homes Sold
Condo 1
Townhouse 15
Single Family 52
Overall 68
May, 2020
Homes Sold
Condo 4
Townhouse 13
Single Family 31
Overall 48
June, 2020
Homes Sold
Condo 1
Townhouse 12
Single Family 72
Overall 85
July, 2020
Homes Sold
Condo 6
Townhouse 29
Single Family 96
Overall 131
August, 2020
Homes Sold
Condo 3
Townhouse 19
Single Family 84
Overall 106
September, 2020
Homes Sold
Condo 6
Townhouse 31
Single Family 105
Overall 142
October, 2020
Homes Sold
Condo 4
Townhouse 36
Single Family 106
Overall 146
November, 2020
Homes Sold
Condo 3
Townhouse 28
Single Family 95
Overall 126
December, 2020
Homes Sold
Condo 2
Townhouse 16
Single Family 83
Overall 101
January, 2021
Homes Sold
Condo 4
Townhouse 14
Single Family 87
Overall 105
February, 2021
Homes Sold
Condo 5
Townhouse 18
Single Family 92
Overall 115
Homes sold in the last 12 months in Lake Nona, Florida
Condo
Townhouse
Single Family
Overall
Homes sold in the last 12 months in Lake Nona, Florida

Average Time to Sell a Home in Lake Nona

The Lake Nona housing market is going strong even after the COVID-19 pandemic.

Lake Nona houses, condos, townhomes and other properties are being snapped up in no time at all.

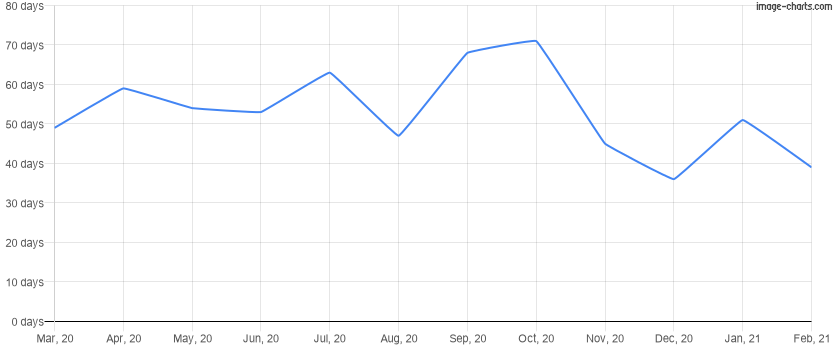
To this point, properties for sale in Lake Nona spent only 39 days on the market in February, 2021.

This further corroborates what we know from other statistics: that competition among buyers is high.

March, 2020
Average Time To Sale 49 Days
April, 2020
Average Time To Sale 59 Days
May, 2020
Average Time To Sale 54 Days
June, 2020
Average Time To Sale 53 Days
July, 2020
Average Time To Sale 63 Days
August, 2020
Average Time To Sale 47 Days
September, 2020
Average Time To Sale 68 Days
October, 2020
Average Time To Sale 71 Days
November, 2020
Average Time To Sale 45 Days
December, 2020
Average Time To Sale 36 Days
January, 2021
Average Time To Sale 51 Days
February, 2021
Average Time To Sale 39 Days
Average time to sell a home for the last 12 months in Lake Nona, Florida
Average Time To Sale
Average time to sell a home for the last 12 months in Lake Nona, Florida

What Are the Average Mortgage Rates in Lake Nona, Florida?

In other Lake Nona real estate news, mortgage rates are at an all-time low.

As of February, 2021 the average mortgage rate in Lake Nona, FL was only 2.73%.

And as more and more Orlando area buyers are assured by these record low mortgage rates, sales rise.

March, 2020
Average Mortage Rates 3.45%
April, 2020
Average Mortage Rates 3.20%
May, 2020
Average Mortage Rates 3.22%
June, 2020
Average Mortage Rates 3.04%
July, 2020
Average Mortage Rates 2.97%
August, 2020
Average Mortage Rates 2.85%
September, 2020
Average Mortage Rates 2.74%
October, 2020
Average Mortage Rates 2.72%
November, 2020
Average Mortage Rates 2.70%
December, 2020
Average Mortage Rates 2.70%
January, 2021
Average Mortage Rates 2.73%
February, 2021
Average Mortage Rates 2.73%
Average mortgage rate for the last 12 months in Lake Nona, Florida
Average Mortage Rates
Average mortgage rate for the last 12 months in Lake Nona, Florida

How Did COVID-19 Affect the Lake Nona Real Estate Market?

Covid-19 actually had positive effects for the region according to the Lake Nona housing market statistics.

  • In general, Lake Nona’s average home price increased and sales went up.
  • Although sales volume initially slumped in March and April when the Covid-19 virus first came to light in the US, sales already started to improve in May.
  • On the other hand, median Lake Nona home prices never decreased.
  • In fact, the average home price in Lake Nona surged even as the pandemic started to ramp up.
  • Covid also affected central Florida’s economy and population in an unexpected way.
  • Every day, approximately 1,000 new people move into Florida.
  • Northeasterners and especially New Yorkers are sick of living in small, expensive apartments during the lockdowns.
  • As a result, the desire to live elsewhere swells.
  • Emphatically, Lake Nona housing market statistics are looking hot because this influx of out-of-staters eagerly buy up and rent out homes.

Homes for Sale in Lake Nona

Lake Nona is one of the most popular luxury suburbs in Orlando for many reasons.

First off, homes for sale in Lake Nona offer access to some of the best amenities for families.

Such as brand-name shopping, playgrounds, miles of hiking trails, and health food grocers.

Additionally, this amazing community is located just southeast of Downtown Orlando, making it the perfect commuter area.

For these factors and so much more, homes for sale in Lake Nona are in high demand among Orlando buyers and investors.

Making a Lake Nona real estate investment a strong bet in the upcoming fiscal year.

Lake Nona Demographics

Because of its location and strong economy, Lake Nona is an upper middle class community full of working professionals and families.

According to Lake Nona housing market statistics and census information, the average household income here is $101,785.47.

Generally, the community is very safe and residents are well educated.

March, 2020
Demographics
Area´s Population 11,718
Average Household Income $101,785.47
Area´s Area Size 17
April, 2020
Demographics
Area´s Population 11,718
Average Household Income $101,785.47
Area´s Area Size 17
May, 2020
Demographics
Area´s Population 11,718
Average Household Income $101,785.47
Area´s Area Size 17
June, 2020
Demographics
Area´s Population 11,718
Average Household Income $101,785.47
Area´s Area Size 17
July, 2020
Demographics
Area´s Population 11,718
Average Household Income $101,785.47
Area´s Area Size 17
August, 2020
Demographics
Area´s Population 11,718
Average Household Income $101,785.47
Area´s Area Size 17
September, 2020
Demographics
Area´s Population 11,718
Average Household Income $101,785.47
Area´s Area Size 17
October, 2020
Demographics
Area´s Population 11,718
Average Household Income $101,785.47
Area´s Area Size 17
November, 2020
Demographics
Area´s Population 11,718
Average Household Income $101,785.47
Area´s Area Size 17
December, 2020
Demographics
Area´s Population 11,718
Average Household Income $101,785.47
Area´s Area Size 17
January, 2021
Demographics
Area´s Population 11,718
Average Household Income $101,785.47
Area´s Area Size 17
February, 2021
Demographics
Area´s Population 11,718
Average Household Income $101,785.47
Area´s Area Size 17

Population: How Many People Live in Lake Nona?

According to city-data.com, approximately, 11,718 people currently live in Lake Nona.

Of these 11,700, 6,000 are women and 5,700 are male.

In total, there are 4,250 households in Lake Nona each consisting of three people on average.

When referencing Lake Nona housing market statistics, 3,191 of these are considered family households.


Average Household Income

Lake Nona household demographics show that 84% of residents in Lake Nona are white collar.

Due to this fact, the average household income skews quite high at $101,785.47.

According to niche.com, education is also highly valued in the Lake Nona community.

Consequently, over 35% of residents have a Bachelor’s degree and another 37.62% have some college experience.


Lake Nona Area Size

Lake Nona is a planned residential community spread out over 17 square miles of land.

Although Lake Nona is considered to be its own luxurious city, it sits within Orlando's metropolitan limits.

Lake Nona Real Estate Rental Market Statistics

Though the Covid pandemic boosted the Lake Nona area real estate forecast, it didn’t have the same effect on the rental market.

As a whole, vacation home owners and renters were the most negatively affected demographic.

Rental home occupancy rates at the beginning of Covid in March, April, and May were at an all-time low.

In Florida, there was even public health law in place banning short term vacation rentals.

Unsurprisingly then, the Lake Nona and Orlando area rental real estate market was slow.

However, there came a light at the end of the tunnel for Lake Nona vacation home owners as rental rates started to pick up again in summer.

By December, 2020, occupancy rates were back to full capacity.

To the delight of home owners, every vacation home or property was occupied for Christmas and New Year’s.

Accordingly, the short term rental market will continue to recover, especially after more people get vaccinated and travel bans are lifted.

What is the Average and Median Rental Price in Lake Nona?

On average, the price to rent a Lake Nona home in February, 2021 was approximately $2,210.

Balanced against the fact that the COVID-19 pandemic and travel restrictions continue off and on in some states, demand for rental properties in Lake Nona is still high.

This is because Florida is seeing an influx of 1,000 new residents every day as a result of the pandemic.

Northeasterners are moving to Orlando in search of a better quality of life and cheap property.

March, 2020
Rental Prices Average Median
Condo $1,505 $1,424
Townhouse $1,899 $1,825
Single Family $2,578 $2,225
Overall $2,158 $2,970
April, 2020
Rental Prices Average Median
Condo $1,503 $1,370
Townhouse $1,833 $1,825
Single Family $2,217 $2,198
Overall $2,007 $1,998
May, 2020
Rental Prices Average Median
Condo $1,481 $1,485
Townhouse $1,897 $1,898
Single Family $2,413 $2,297
Overall $2,171 $2,100
June, 2020
Rental Prices Average Median
Condo $2,220 $1,400
Townhouse $1,960 $1,970
Single Family $2,472 $2,400
Overall $2,255 $2,250
July, 2020
Rental Prices Average Median
Condo $1,638 $1,605
Townhouse $1,949 $1,925
Single Family $2,867 $2,650
Overall $2,388 $2,200
August, 2020
Rental Prices Average Median
Condo $1,550 $1,475
Townhouse $1,911 $1,838
Single Family $2,525 $2,350
Overall $2,276 $2,123
September, 2020
Rental Prices Average Median
Condo $1,700 $1,475
Townhouse $1,947 $1,983
Single Family $2,431 $2,175
Overall $2,276 $2,100
October, 2020
Rental Prices Average Median
Condo $1,700 $1,475
Townhouse $1,963 $1,995
Single Family $2,214 $2,200
Overall $2,109 $2,095
November, 2020
Rental Prices Average Median
Condo $1,492 $1,475
Townhouse $1,932 $1,925
Single Family $2,590 $2,400
Overall $2,214 $2,090
December, 2020
Rental Prices Average Median
Condo $1,493 $1,395
Townhouse $1,860 $1,875
Single Family $2,613 $1,438
Overall $2,186 $2,000
January, 2021
Rental Prices Average Median
Condo $1,482 $1,495
Townhouse $1,878 $1,900
Single Family $2,862 $2,525
Overall $2,366 $2,248
February, 2021
Rental Prices Average Median
Condo $1,423 $1,400
Townhouse $1,904 $1,900
Single Family $2,535 $2,550
Overall $2,210 $2,075
Average rent price for the last 12 months in Lake Nona, Florida
Condo
Townhouse
Single Family
Overall
Average rent price for the last 12 months in Lake Nona, Florida

For Rent: Average Price per Square Foot

January 2021 is seeing the rise of a hot and attractive renters’ market.

People and businesses are flowing into the city like never before.

Therefore, Orlando is ranked as one of the best places to buy a rental property.

The average rental price of $1.10 per square foot reflects Orlando’s ongoing rental popularity.

Unsurprisingly, 86% of residents report that Orlando is a “very good” place to live, own, and rent according to niche.com.

March, 2020
Average Rental Price Per Square Foot $1.14
April, 2020
Average Rental Price Per Square Foot $1.10
May, 2020
Average Rental Price Per Square Foot $1.07
June, 2020
Average Rental Price Per Square Foot $1.09
July, 2020
Average Rental Price Per Square Foot $1.10
August, 2020
Average Rental Price Per Square Foot $1.07
September, 2020
Average Rental Price Per Square Foot $1.06
October, 2020
Average Rental Price Per Square Foot $1.06
November, 2020
Average Rental Price Per Square Foot $1.11
December, 2020
Average Rental Price Per Square Foot $1.20
January, 2021
Average Rental Price Per Square Foot $1.20
February, 2021
Average Rental Price Per Square Foot $1.10
Average rent price per square foot for the last 12 months in Lake Nona, Florida
Average Rental Price Per Square Foot
Average rent price per square foot for the last 12 months in Lake Nona, Florida

Lake Nona for Rent Inventory

As more people move into Orlando in search of a Lake Nona real estate investment, the number of free rental properties goes down.

All in all, this is another sign of a January 2021 renter’s market.

Lake Nona housing market statistics show that the number of rental homes and properties available as of February, 2021 was just 42.

Breaking it down by home type, we find that 25 of those homes were houses, 5 were condos and 12 were townhomes.

March, 2020
For Rent Inventory
Condo 7
Townhouse 29
Single Family 27
Overall 63
April, 2020
For Rent Inventory
Condo 8
Townhouse 24
Single Family 32
Overall 64
May, 2020
For Rent Inventory
Condo 4
Townhouse 20
Single Family 30
Overall 54
June, 2020
For Rent Inventory
Condo 7
Townhouse 27
Single Family 29
Overall 63
July, 2020
For Rent Inventory
Condo 8
Townhouse 22
Single Family 28
Overall 58
August, 2020
For Rent Inventory
Condo 6
Townhouse 23
Single Family 22
Overall 51
September, 2020
For Rent Inventory
Condo 4
Townhouse 25
Single Family 33
Overall 62
October, 2020
For Rent Inventory
Condo 7
Townhouse 21
Single Family 22
Overall 50
November, 2020
For Rent Inventory
Condo 6
Townhouse 25
Single Family 27
Overall 58
December, 2020
For Rent Inventory
Condo 5
Townhouse 23
Single Family 25
Overall 53
January, 2021
For Rent Inventory
Condo 3
Townhouse 21
Single Family 26
Overall 50
February, 2021
For Rent Inventory
Condo 5
Townhouse 12
Single Family 25
Overall 42
For rent inventory for the last 12 months in Lake Nona, Florida
Condo
Townhouse
Single Family
Overall
For rent inventory for the last 12 months in Lake Nona, Florida

Rented Homes in Lake Nona

A diverse array of properties were up for rent on the Orlando housing market in December, 2020.

In total, February, 2021 saw 45 occupied rental properties in Orlando and Lake Nona.

Of these, 19 were townhomes, 3 were condos and 23 were single-family homes.

March, 2020
Homes Rented
Condo 11
Townhouse 21
Single Family 30
Overall 62
April, 2020
Homes Rented
Condo 6
Townhouse 14
Single Family 26
Overall 46
May, 2020
Homes Rented
Condo 6
Townhouse 22
Single Family 42
Overall 70
June, 2020
Homes Rented
Condo 5
Townhouse 37
Single Family 51
Overall 93
July, 2020
Homes Rented
Condo 6
Townhouse 29
Single Family 36
Overall 71
August, 2020
Homes Rented
Condo 1
Townhouse 26
Single Family 41
Overall 68
September, 2020
Homes Rented
Condo 0
Townhouse 16
Single Family 34
Overall 50
October, 2020
Homes Rented
Condo 1
Townhouse 23
Single Family 36
Overall 60
November, 2020
Homes Rented
Condo 3
Townhouse 23
Single Family 23
Overall 49
December, 2020
Homes Rented
Condo 1
Townhouse 29
Single Family 24
Overall 54
January, 2021
Homes Rented
Condo 4
Townhouse 30
Single Family 26
Overall 60
February, 2021
Homes Rented
Condo 3
Townhouse 19
Single Family 23
Overall 45
Homes rented in the last 12 months in Lake Nona, Florida
Condo
Townhouse
Single Family
Overall
Homes rented in the last 12 months in Lake Nona, Florida

Average Time to Rent a Home in Lake Nona

For the most part, the process of renting a home in Lake Nona, FL is pretty easy.

On average, in February, 2021 it only took 24 days to rent a home from the start of the research process to move-in.

Typically in the US, this process takes 30 to 60 days.

This means that the rental market is hot and new Lake Nona residents are looking for temporary, short and long-term living accommodations.

March, 2020
Average Time to Rent 41 Days
April, 2020
Average Time to Rent 37 Days
May, 2020
Average Time to Rent 34 Days
June, 2020
Average Time to Rent 34 Days
July, 2020
Average Time to Rent 28 Days
August, 2020
Average Time to Rent 25 Days
September, 2020
Average Time to Rent 24 Days
October, 2020
Average Time to Rent 34 Days
November, 2020
Average Time to Rent 32 Days
December, 2020
Average Time to Rent 36 Days
January, 2021
Average Time to Rent 53 Days
February, 2021
Average Time to Rent 24 Days
Average time to rent a property for the last 12 months in Lake Nona, Florida
Average Time to Rent
Average time to rent a property for the last 12 months in Lake Nona, Florida

Lake Nona Real Estate Investment

Undoubtedly, a Lake Nona real estate investment is a good idea.

Whether you invest in a single-family home, townhome, or other property, a high ROI is almost guaranteed thanks to Orlando’s economic rise.

Additionally, investing in a rental or vacation property in Lake Nona is also a great plan.

Florida’s vacation home rental industry is worth about $30 billion.

Furthermore, median home prices in Orlando and Lake Nona have risen steadily over the past few years.

Why Should I Buy a Property in Lake Nona, Florida?

While Orlando real estate in general is a good investment, Lake Nona, FL properties are particularly valuable.

  • Lake Nona is a trendy community located just a few miles from the heart of Orlando.
  • In addition, this stellar Orlando community is home to the United States Tennis Association’s National Campus and the world-renowned Lake Nona Medical City.
  • Here, the median listing home price is around $515,837 making Lake Nona a fairly competitive housing market.
  • Additionally, the median age is 33, which means the city is rife with qualified, potential first-time home renters and buyers.

Lake Nona Real Estate News

Real estate investors and industry experts predicted that the market would crash from the effects of the Coronavirus pandemic.

However, the opposite has happened.

Lake Nona and Orlando are growing, and the economy is getting stronger.

New developments are popping up all over the region.

For example, Celebration, a city just west of Lake Nona is, well, celebrating its newest community called Island Village that will offer more than 1,300 new homes.

Additionally, downtown Lake Nona itself will also get a new, massive masterplan area for commercial real estate like stores and malls.

Overall, Orlando real estate and Lake Nona real estate investments are appreciating more and more and are expected to keep going.

Lake Nona Real Estate Market Forecast

All in all, the forecast for the Lake Nona real estate market is looking favorable.

2020 brought an influx of new Orlando residents and 2021 is expected to bring in even more.

Californians, New Yorkers, and Bostonians are moving to Orlando and Lake Nona in record numbers.

Evidently, they are turning to Florida for lower taxes and relief from the wet, gray, cold weather of the Northeast.

Hence, the way the Lake Nona real estate market is trending, in 10 to 15 years, the Lake Nona average home price may rival California and New York property values.

For further proof of this exponential growth, simply look at the many new communities that are developing in the Orlando region.

For this reason, investors should consider a Lake Nona real estate investment or property now before it’s too late.

Currently, the Florida economy is the fourth largest in the country.

However, Florida might bump off New York for the number-three slot fairly soon.

Based on Orlando and Lake Nona average home prices and the state’s increasing population, the economic trend is pointing towards a positive result.

In general, Florida is getting 30,000 new residents every month.

Below, we detail past Orlando real estate performance with data from orlandorealtors.org.

Lake Nona Real Estate Market Historical Data

2007

Real Estate Market Overview in 2007

The Orlando real estate market was tough in 2007 as YoY sales were down by over 30%.

However, median YoY home prices remained relatively consistent but dipped in the last quarter.

Therefore, inventory was high and the average Sell/List price difference was between 93% and 96%.

2008

Real Estate Market Overview in 2008

The Orlando real estate market did not recover in 2008 as YoY sales remained down.

However, six months saw increases in YoY sales and December realized a 30% sales increase.

In general, inventory supply remained high and January saw a 30% inventory increase.

The average list price was about $260,000, but the difference between listing and selling prices was between 93% and 94%.

2009

Real Estate Market Overview in 2009

In 2009, the Orlando real estate market began to improve as every month saw at least a 30% YoY sales increase and November saw a 109% YoY sales increase.

Unfortunately, the median home price remained low at approximately $135,000.

Lots of inventory was snatched off the market every month and each month realized negative inventory values.

2010

Real Estate Market Overview in 2010

Lucky for sellers, the Orlando real estate market saw an uptick in 2010 as more buyers were attracted by lower interest rates.

YoY sales increased by up to 70% during the first half of the year.

However, the average sales price saw a slight increase but remained low at $140,000.

The difference between Sales/List price also saw a slight rise to 95%.

2011

Real Estate Market Overview in 2011

The 2011 Orlando real estate market remained approximately comparable to the performance of the previous year.

Sales dipped by up to 11% in the first half of the year but recovered and saw positive increases of approximately 9%.

The Lake Nona average home price and Orlando home sales prices and Sale/List price percent differences remained the same as in the year previous.

2012

Real Estate Market Overview in 2012

2012 saw a strengthening of the Orlando real estate market.

Sales dropped during the first half of the year but improved steadily over the second half.

The average sales price also increased in the second half of the year and peaked in December at $173,000 while the Sale/List price difference increased to 96%.

2013

Real Estate Market Overview in 2013

The Orlando real estate market performed strongly in 2013.

In short, the first nine months of the year saw YoY sales increases and average sales prices remained robust between $167,000 and $200,000.

The first three months were a seller’s market and the rest of the year was a buyer’s market as inventory supply was higher than demand.

2014

Real Estate Market Overview in 2014

Results were less than desirable for the 2014 Orlando real estate market.

Every month in the first half of the year saw a drop in YoY sales figures, however, there was a significant upturn in the last quarter.

The median home price remained rather stagnant at approximately $160,000 and the average sale price was approximately $200,000.

Inventory was up as high as 12,000 in some months as a buyer’s market reigned.

2015

Real Estate Market Overview in 2015

Interest rates were low in 2015 which means that the Orlando real estate market performed well with strong sales and high average sales prices.

YoY sales were up by 8% to 40% in the first three quarters of the year.

Inventory was also high at approximately 11,000 every month and Sales/List differences favored buyers at about 96%.

2016

Real Estate Market Overview in 2016

In 2016, the Orlando real estate market fluctuated as YoY sales alternated positively and negatively almost every other month.

However, the average Sales/List price difference increased to approximately 97% and the average Lake Nona home price and Orlando home prices remained consistent at about $235,000.

2017

Real Estate Market Overview in 2017

2017 showed signs an Orlando real estate market in recovery as sales increased and remained strong throughout the year.

Low interest rates also helped with this market boost.

YoY sales saw a modest bump of about 3 to 14%.

The Lake Nona average home price also increased to $270,000 and YoY inventory dropped consistently during the second half of the year.

2018

Real Estate Market Overview in 2018

2018 was less promising for the Orlando real estate market than the previous year.

Sales dipped significantly in May, June, November and December and median sales prices hovered at about $230,000.

On the other hand, inventory decreased from 2017 to 2018 which signaled a slow transition to a seller’s market.

2019

Real Estate Market Overview in 2019

The 2019 Orlando real estate market was generally strong in terms of sales and median sales prices.

In December, YoY sales increased by over 25% and the median sales price hovered at about $240,000.

Sales/List price differences remained constant at approximately 97%.

2020

Real Estate Market Overview in 2020

Even after the effects of the Coronavirus pandemic, the Orlando real estate market remained strong with YoY sales up during 10 out of 12 months of the year.

The second half of the year was also strong in terms of median pricing, and the average sales price increased steadily over the course of the year.

In general, 2020 was a very strong seller’s market year.

2021

Real Estate Market Overview in 2021

As we look toward the future, we predict that this year will bring more growth for the Lake Nona real estate market.

Orlando Real Estate Market

Still not sold on the idea of Lake Nona?

Check out our Orlando real estate market overview to see how the rest of the Greater Orlando Area is doing!

A Lake Nona Realtor for All Your Needs

Lake Nona boasts an array of homes at an array of price points.

Count on an Authentic Real Estate Team Lake Nona real estate agent to help you find the best home for your needs!

Condos and Apartments for Sale in Lake Nona

Whether you’re looking for a low-maintenance place to live or invest, count on Authentic Real Estate Team to help you find the best condos for sale in Lake Nona for your needs.

Lakefront Homes in Lake Nona

Whether you’re an investor or residential buyer, Lake Nona lakefront homes for sale offer tremendous value for your portfolio and your quality of life.

New Homes for Sale in Lake Nona

New homes for sale in Lake Nona appreciate faster than older homes.

And you’ll appreciate having fewer maintenance issues to contend with.

Luxury Homes for Sale in Lake Nona

As the premier luxury home broker in the Orlando area, Authentic Real Estate Team can help you find great deals on luxury homes for sale in Lake Nona FL.

Vacation Homes for Sale in Lake Nona

With a prime location near the Orlando Airport, and a mere 20-minute commute to Disney, Lake Nona vacation homes for sale make great homes away from home!

Villas for Sale in Lake Nona

Count on Authentic Real Estate Team to help you find the best Lake Nona villas for sale at the best prices for your needs!

Community Homes for Sale in Lake Nona

Community homes give you the benefit of quality homes by trusted builders, and luxury amenities.

And with gated entrances, the safety your family – and your assets – deserve.

Here are a few of the Lake Nona communities we serve.

Storey Park

Storey Park is Lake Nona’s newest master-planned community.

It features luxury homes by renowned builder, Lennar Homes.

As well as a generous amenities package that includes a pool, splash pad, playgrounds, trails, and more!

Lake Nona Golf and Country Club

One of Florida’s premier private golf communities, Lake Nona Golf and Country Club boasts luxury homes with views of the eponymous Tom Fazio-designed course.

Other perks include sparkling lakes, tennis facilities, a state-of-the-art gym, and a gated, guarded entrance.

Randal Park

Randal Park is a new master-planned community in Lake Nona.

It features luxury, energy-efficient homes and townhouses by Mattamy Homes.

As well as 8 community parks, miles of walking trails, and convenient access to SR417.

Eagle Creek

Eagle Creek features luxury homes on Eagle Creek Golf Course.

The community also boasts a robust amenities package that includes a private clubhouse, 120-seat restaurant, and pro shop.

Laureate Park

Laureate Park features craftsman bungalows, townhomes, and estate homes ranging from the 300’s to over a million dollars.

It also boasts an amazing location, with top-rated schools, medical facilities, and a strong job market all within easy reach.

Conclusion: Why You Should Invest with Authentic Real Estate Team

So now the question remains: how will you choose to invest in the growing Lake Nona housing market?

The Lake Nona FL housing market is truly on the riseand is projected to keep rising.

Contact one of our trusted and experienced Authentic Real Estate brokers today to find the right Lake Nona real estate investment for you!

Quick links

See also the real estate market in other cities

See also the real estate market of

Lake Nona

Lake Nona

See also the real estate market of

Kissimmee

Kissimmee

See also the real estate market of

Davenport

Davenport

See also the real estate market of

Clermont

Clermont

See also the real estate market of

Reunion

Reunion

Subscribe to our newsletter

Keep up to date with the lastest news, trends,
communities, special deals and more!

Menu
PhoneSMSWhatsApp Email
Loading
Alert
Do you want to continue?
Cancel
Yes!